About
The plugin allows to organize up-to-down planning for complex software and similar projects. Unlike Kanban or SCRAM approaches, providing flat list of tasks, a Blow board visualizes task’s hierarchy and their distribution over executors. The main goal is providing very quick overview of the current project state with clear understanding what should be done next for each of team members.
Setup
| You can see the plugin operation in Demo System. |
Process Queue
Each board used as primary data list of processes from a process queue. About filtering and sorting the plugin takes care itself. Depending on shown data for the queue have to be configured necessary columns, like for examples in the Demo:
// PzdcDoc snippet of: 'Plugin Blow process queue config', lines: 1 - 13

column.1.title=ID
column.1.value=id
# queue debugging columns
column.4.title=Description
column.4.value=descriptionLink
column.4.titleIfMore=100
# board used columns
column.10.title=MIC
column.10.value=messageInCount
column.12.title=MIUC
column.12.value=messageInUnreadCount
column.20.title=Status changed
column.20.value=status_dt:dd.MM.yyyy
Board
Make sure the plugin is enabled and append to the configuration:
blow:board.<ID>.title=<TITLE>
blow:board.<ID>.queueId=<queueId>
# optional keys
blow:board.<ID>.executor.groups=<groupIds>
blow:board.<ID>.executor.roles=<roleIds>
blow:board.<ID>.expressionCell=<expressionCell>
blow:board.<ID>.openUrl=<openUrl>
Where:
-
<ID> - unique numeric board ID;
-
<TITLE> - board title;
-
<queueId> - primary data process queue ID;
-
<groupIds> - comma-separated process execution groups IDs, by default all groups are taken;
-
<roleIds> - comma-separated process execution roles IDs, by default only role 0 is taken;
-
<openUrl> - board name for publishing on open interface with URL ../open/blow/<openUrl>.
<expressionCell> contains JEXL expression for evaluating of cell text. In the expression context beside default variables and process are passed queue column values as variables colX, where X is a column ID. If not defined in the board cells are shown process descriptions.
Here is an example of a configuration in the Demo.
// PzdcDoc snippet of: 'Plugin Blow board config', lines: 4 - 27

blow:board.1.expressionCell=<<END
     result = "";

     typeId = process.getTypeId();
     if ({@PROCESS_TYPE_INCIDENT_ID} == typeId) {
          result += "I: ";
     }

     result += u.htmlEncode(process.getDescription()) + " [<b>" + ctxProcessStatusMap[process.getStatusId()];
     if (process.getExecutorIdsWithRole(0).size() > 0) {
        result += " " + params.get("col{@COL_STATUS_CHANGED}");
     }
     result += "</b>]";

     msgCnt = params.get("col{@COL_MESSAGES}");
     if (msgCnt) {
         result += " " + msgCnt;
         unreadCnt = params.get("col{@COL_MESSAGES_UNREAD}");
         if (unreadCnt)
            result += " (<b>" + unreadCnt + "</b>)";
     }

     return result;
END
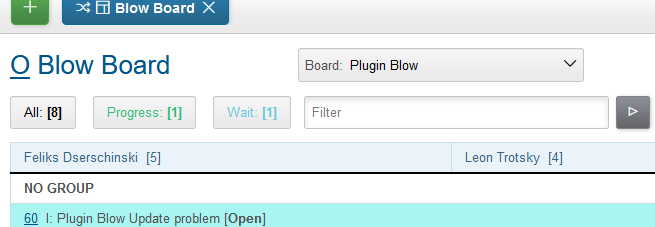
A resulting cell looks like that for process with unread messages.

Or like that for a process with incident type.

Filters
Filters are buttons with script generated texts, placed over a board and matching some processes on the board. Click on the buttons highlights matching processes with the filter’s color and scrolls to the hightest of them. Here are the filters from Demo:
And the implementing them configuration.
// PzdcDoc snippet of: 'Plugin Blow board filters config', lines: 35 - 57

blow:board.1.filter.{@inc:cnt}.color=#31bc79
blow:board.1.filter.{@cnt}.expression=<<END
     count = 0;
     for (item : items) {
          if (item.getProcess().getStatusId() =~ [{@PROCESS_STATUS_PROGRESS_ID}]) {
               count += 1;
               item.addFilterId(filter.getId());
          }
     }
    return "Progress: <b>[" + count + "]</b>";
END

blow:board.1.filter.{@inc:cnt}.color=#67c7db
blow:board.1.filter.{@cnt}.expression=<<END
     count = 0;
     for (item : items) {
          if (item.getProcess().getStatusId() =~ [{@PROCESS_STATUS_WAIT_ID}]) {
               count += 1;
               item.addFilterId(filter.getId());
          }
     }
    return "Wait: <b>[" + count + "]</b>";
END
Usage
Blow plan is presented in a table form where columns are executors and processes are shown in cells with generated text and opening link. For displaying are taken only open processes without closing date.
Process Groups
Process hierarchy is based on relation type Made. Note that all classical planning entities like tasks, projects, sub-projects are implemented only using parent - child processes with only two levels of depth. On the screen below you can see two such process groups: 56 parent with 57 and 58 children and 53 - 55 - 54.
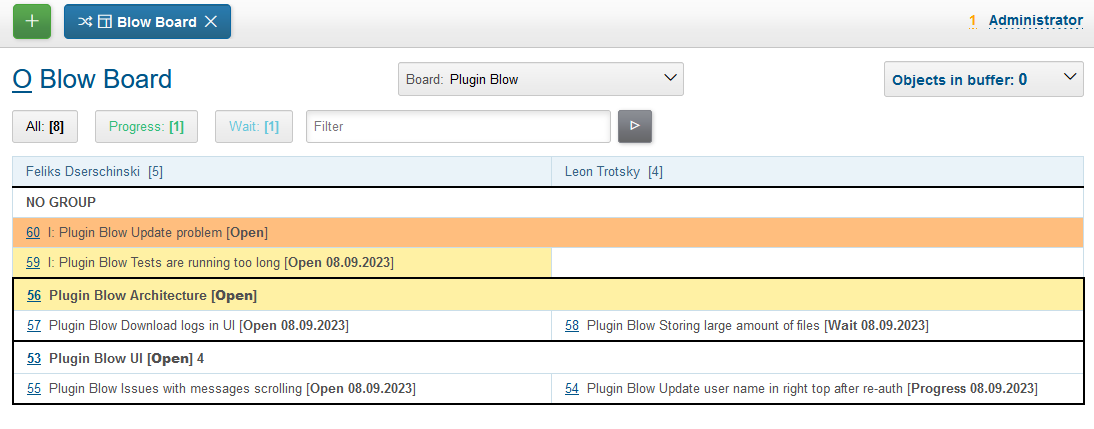
Moving mouse over highlights the process group under cursor. Using mouse drag-and-drop child processes can be moved to other groups. On the screens below the 58 child process is being moved to 53 parent.

After that the planning board has the following view.

The same action can be performed used right-click popup menu with items Cut and Paste there. That way is especially good for large boards.

Another possible operation after Cut would be Merge, allowing to concatenate all messages from a cut process to the target one. It can be used for joining processes with same functionality, going to be done at once.
Independent processes are shown under fake NO GROUP parent and behave in general like all other groups. Child processes can be moved from and to it using drag-and-drop or Cut - Paste menu items from right click popup menu. There is also available separated Make independent item, allowing a quick way to make child processes independent, placed in NO GROUP.
The last still not described here right-click menu item is Clone process, it makes duplicate of a clicked process with same type, description, but without messages.
Executors
Processes with no or many executers are shown for the full table width. Such processes are meant as unassigned, if a parent process has at least one unassigned child process, the parent is also treated like unassigned.
Ordering
For process group sorting are used the following criteria, as an example you can use the previous screen:
-
the more priority is higher: processes 60 - 56 - 59 / 53;
-
unassigned is higher than assigned;
-
further status is higher than earlier;
-
parent process is higher than independent or child.
The idea behind the rules is showing the next doing processes on the board’s top.
Messages
Unlike in other planning tools process is not the smallest unit of work that can be done. You shouldn’t create a new process for any wish or remark. Instead you may collect them in process messages. Number of them is shown for the Demo board configuration, like 4 on the screen.

And here how do they look inside the process. As you can see, all Blow UI related thoughts just written down.
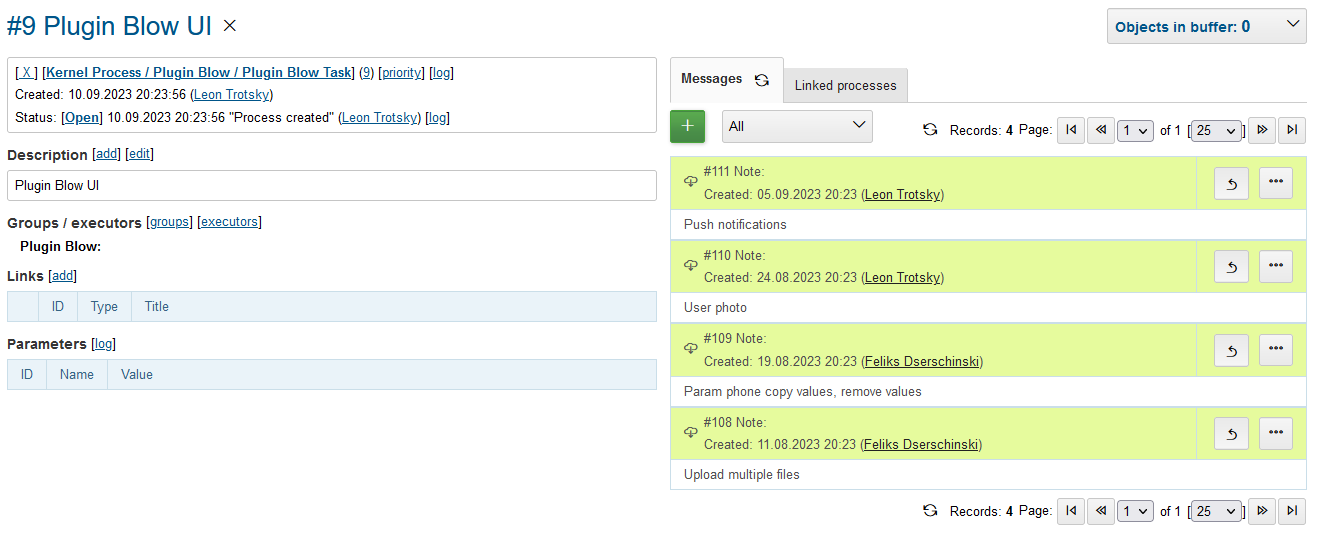
At the board have to be placed only processes which already described to be done at the observable time. So, whenever the time is there, any message can be separated to a new process using … menu, like shown on the screen.
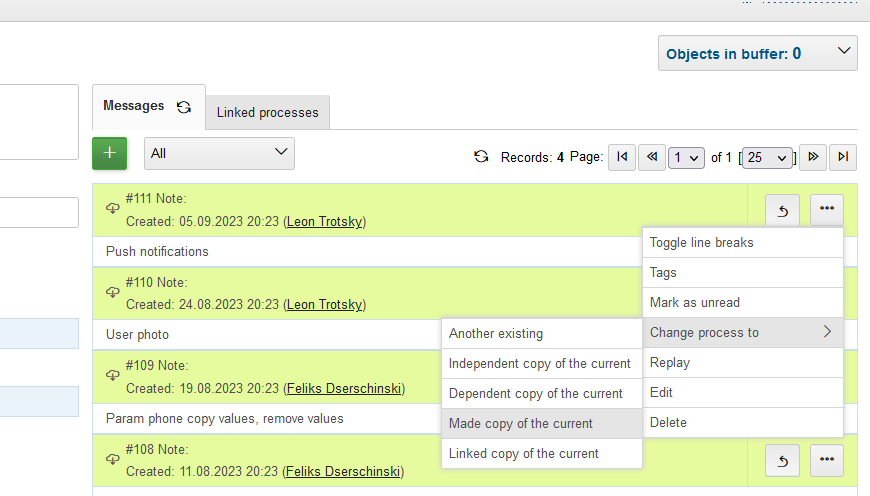
After changing of description the newly created process.

It is available on our board.

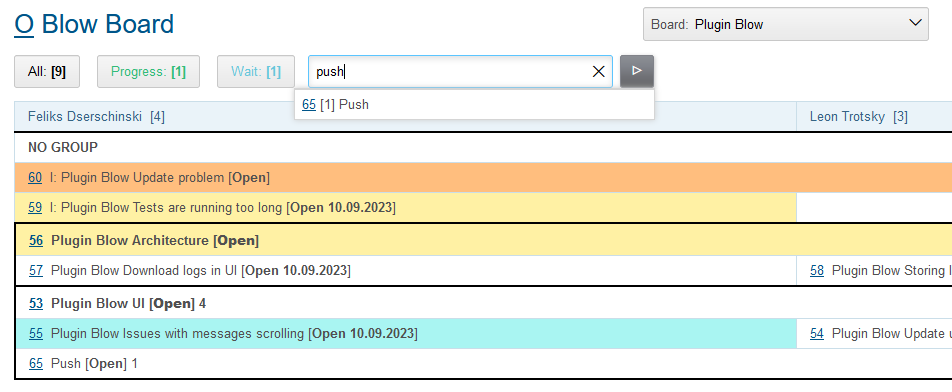
Using Search tool on the top of the board existing messages can be quickly checked on already written remarks. The messages are found by simple substring match, in resulting drop-down are shown processes with count of matching messages in square braces.
